

Email Marketing Analytics: 2026 Metrics and KPIs Guide
Email marketing analytics is the practice of measuring and interpreting how recipients engage with your emails, then using that data to sharpen targeting, improve content, and drive measurable revenue. At its core, it answers a simple question: what actually happened after you hit send? Open rates, click-through rates, conversion rates, deliverability scores, and email ROI are the five metrics that form the foundation of any serious analytics program.
The distinction between a metric and a KPI matters more than most marketers realize. A metric is a raw measurement, like how many people clicked a link. A KPI ties that number to a business goal, such as increasing welcome series click rates by 10 percentage points within a quarter. Without that connection, you are collecting data, not making decisions.
Here is what a complete email analytics framework tracks:
- Open rate — the percentage of delivered emails that recipients opened (increasingly unreliable post-Apple Mail Privacy Protection)
- Click-through rate (CTR) — the share of delivered emails that generated at least one click
- Conversion rate — the percentage of recipients who completed a desired action (purchase, sign-up, download)
- Revenue per email (RPE) — total revenue divided by emails sent; the clearest financial signal in ecommerce
- Deliverability rate — the percentage of emails that actually reached the inbox
- Bounce rate — hard and soft bounces as a share of total sends
- Unsubscribe rate — the percentage of recipients who opted out after a send
- List growth rate — net new subscribers as a percentage of total list size
- Email ROI — revenue generated relative to campaign spend
The payoff for tracking these consistently is significant. Email marketing delivers an average return of $36 to $42 for every $1 spent, putting it among the highest-performing channels in digital marketing. That return does not happen by accident. It comes from brands that treat analytics as a decision-making tool, not a report card.
Table of Contents
- 15 essential email marketing metrics and KPIs you should track
- How to measure and optimize your email marketing campaigns
- Common challenges impacting email marketing analytics
- What email marketing experts say about metrics and KPIs for growth
- Key Takeaways
- How Take-action turns email data into revenue for ecommerce brands
15 essential email marketing metrics and KPIs you should track
Understanding which numbers to watch, and why each one matters, separates brands that grow from brands that guess. The table below maps each metric to its category, formula, and a US benchmark range to give you a working baseline.

| Metric | Category | Formula | US Benchmark |
|---|---|---|---|
| Open Rate | Engagement | Opens ÷ Delivered | (treat as directional only) |
| Click-Through Rate | Engagement | Clicks ÷ Delivered | 2%–5% |
| Click-to-Open Rate (CTOR) | Engagement | Clicks ÷ Opens | 10%–15% |
| Conversion Rate | Conversion | Conversions ÷ Delivered | 1%–5% |
| Revenue per Email | Conversion | Total Revenue ÷ Emails Sent | Varies by industry |
| Overall Email ROI | Conversion | (Revenue – Cost) ÷ Cost | 3600%–4200% |
| Deliverability Rate | Deliverability | Delivered ÷ Sent | — |
| Hard Bounce Rate | Deliverability | Hard Bounces ÷ Sent | Below 2% |
| Soft Bounce Rate | Deliverability | Soft Bounces ÷ Sent | Below 5% |
| Spam Complaint Rate | Deliverability | Complaints ÷ Delivered | Below 0.1% |
| Unsubscribe Rate | List Health | Unsubscribes ÷ Delivered | Below 0.5% |
| List Growth Rate | List Health | (New Subs – Unsubs) ÷ Total List | Positive month-over-month |
| Email Sharing/Forwarding Rate | Engagement | Shares ÷ Delivered | 0.1%–0.5% |
| Mobile Open Rate | Engagement | Mobile Opens ÷ Total Opens | 40%–60% |
| Engagement Rate | Engagement | (Opens + Clicks + Replies + Forwards) ÷ Delivered | Varies; track as a trend |
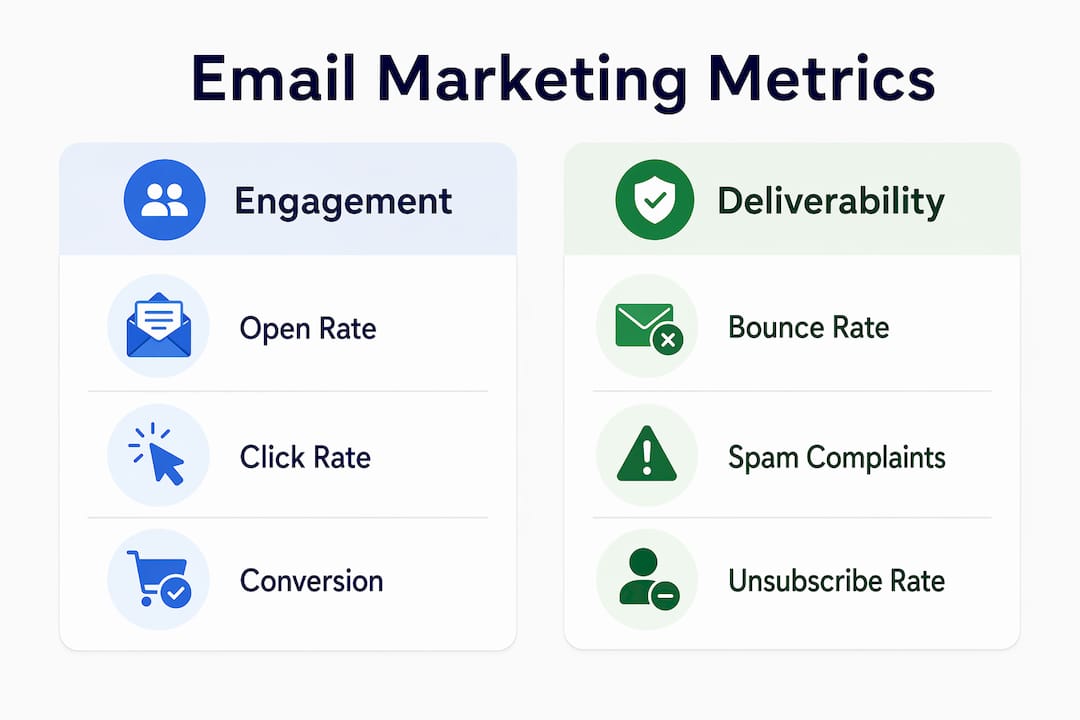
Engagement metrics
Open rate is the most-watched number in email marketing and, since Apple’s Mail Privacy Protection began pre-loading tracking pixels, also the most misleading. Open rates on Apple Mail are now artificially inflated because the pixel fires regardless of whether a human actually read the email. Use open rate as a directional signal, not a performance verdict.
Click-through rate is the more reliable engagement measure. It reflects a deliberate action: someone read enough to click. Click-to-open rate (CTOR) goes one level deeper by measuring how compelling your content is to people who already opened, stripping out the deliverability noise.
- Watch for a rising CTOR alongside a flat CTR — it usually means your subject lines are working but your email body is not converting interest into clicks.
- Mobile open rate matters because a subject line that reads well on desktop can truncate badly on a 375-pixel screen, killing engagement before the email body even loads.
Deliverability metrics
Deliverability rate is the prerequisite for everything else. An email that never reaches the inbox cannot be opened, clicked, or converted. Keep your hard bounce rate below 2% and your spam complaint rate below 0.1%; exceeding those thresholds triggers ISP filtering that can suppress your entire sending domain.
Conversion and revenue metrics
Conversion rate and revenue per email are the metrics that most directly reflect business impact. RPE is particularly powerful for ecommerce because it collapses the entire funnel into a single number: how much money does each email you send actually generate? A campaign with a modest CTR but a high RPE is outperforming a campaign with strong clicks but weak purchases.
- Never judge a campaign by open rate alone when RPE is available.
- Track RPE by flow type (welcome, abandoned cart, post-purchase) to identify which automations carry the most revenue weight.
List health metrics
List growth rate and unsubscribe rate tell you whether your audience is expanding or eroding. A shrinking list with a rising unsubscribe rate is a signal that frequency, relevance, or both are off. Complaint rate is the most urgent list health signal: even a small spike above 0.1% can damage sender reputation within days.
How to measure and optimize your email marketing campaigns
Measuring email performance well is less about the tools you use and more about the sequence you follow. Here is a practical process that works whether you are running a single monthly newsletter or a complex multi-flow automation.
-
Define your goals before you send anything. A campaign designed to recover abandoned carts has different success criteria than one built to re-engage lapsed subscribers. Proper KPIs link metrics to specific business goals, such as increasing welcome series open rates by 10 percentage points within a quarter. Without a defined goal, every number looks equally important, which means none of them are.
-
Select the KPIs that map to each goal. For a revenue goal, track RPE and conversion rate. For a deliverability goal, track bounce rate and complaint rate. For a list health goal, track growth rate and unsubscribe rate. Choosing three focused KPIs beats monitoring fifteen loosely related metrics.
-
Set up tracking integrations before launch. Without integration between your email platform and your CRM or ecommerce backend, revenue attribution becomes guesswork. Klaviyo, for example, connects directly to Shopify and other ecommerce platforms to attribute revenue to specific flows and campaigns. That connection is what makes RPE calculable rather than estimated.
-
Analyze trends, not single sends. One campaign’s numbers tell you almost nothing. A pattern across four to six sends tells you whether a change you made actually worked. Industry experts stress reviewing email analytics as trends over time rather than treating each send as an isolated data point.
-
Segment your audience and analyze each group separately. Segmentation analysis reveals which audience groups engage best and where messaging or frequency adjustments are needed. A re-engagement campaign for subscribers who have not clicked in 90 days should be measured against different benchmarks than a post-purchase flow targeting recent buyers.
-
Run A/B tests informed by your analytics gaps. If CTOR is low, test email body copy and CTA placement. If open rate is declining (even accounting for Apple Mail noise), test subject lines and send times. Let the data tell you where to look; let the test tell you what to change.
-
Reallocate budget and effort based on what the data shows. Analytics without action is just reporting. If your abandoned cart flow generates five times the RPE of your weekly newsletter, that is a signal to invest more in the automation and less in broadcast sends.
Pro Tip: Prioritize behavioral metrics — clicks, conversions, RPE — over passive ones like opens when making budget or content decisions. Behavioral metrics reflect deliberate customer intent; passive ones increasingly reflect software behavior, not human engagement.

Common challenges impacting email marketing analytics
Even marketers who track the right metrics run into problems that distort their data or slow their decision-making. These are the most common ones, and what to do about each.
Apple’s Mail Privacy Protection and open rate inflation
Since Apple introduced Mail Privacy Protection, open rate data for Apple Mail users has been unreliable. The feature pre-loads email content, including tracking pixels, whether or not the recipient actually reads the message. Open rates on Apple Mail are inflated and no longer reliably indicate engagement. The fix is not to stop tracking open rates entirely, but to weight them less and lean harder on CTR, CTOR, and conversion rate as your primary engagement signals.
Data silos blocking accurate revenue attribution
Most email platforms report clicks and opens natively. Revenue attribution requires a connection to wherever transactions actually happen. Data silos impede accurate measurement of RPE and ROI without integration between email platforms and CRM or ecommerce systems. If your email tool and your store operate as separate islands, you are estimating revenue impact rather than measuring it.
Here is a practical checklist for closing the most common analytics gaps:
- Connect your email platform to your ecommerce backend (Shopify, WooCommerce, BigCommerce) for direct revenue attribution.
- Sync email engagement data with your CRM to track lead-to-customer conversion rates across the full funnel.
- Set attribution windows deliberately — a 5-day click attribution window is standard for ecommerce; adjust based on your average purchase cycle.
- Suppress invalid addresses regularly to keep bounce rates below ISP thresholds and protect sender reputation.
- Monitor complaint rates weekly, not monthly — a spike can damage deliverability before your next send.
- Audit your list hygiene quarterly by removing or re-engaging subscribers who have not clicked in 180 days.
- Avoid over-relying on vanity metrics like total opens or list size when reporting to stakeholders; tie every report to a revenue or conversion outcome.
Multi-touch attribution complexity
A subscriber might open a welcome email, ignore three campaigns, click an abandoned cart reminder, and then convert after a post-purchase upsell. Which email gets credit? Last-click attribution, the default in most platforms, gives all the credit to the final touchpoint and systematically undervalues top-of-funnel flows. More accurate models, like linear attribution or time-decay attribution, distribute credit across the sequence. The right model depends on your sales cycle length, but any model is better than defaulting to last-click without questioning it.
Neglecting operational metrics in automated flows
Operational metrics like response time and team workload are often ignored but matter significantly for automated email flows that trigger customer service interactions. If a post-purchase flow generates a surge of reply emails and your team’s response time doubles, that is a customer experience problem that your standard email dashboard will never surface. Build a habit of checking these alongside your engagement metrics, especially for flows that invite replies or direct customer contact.
What email marketing experts say about metrics and KPIs for growth
The gap between brands that use email analytics well and those that do not usually comes down to one habit: treating the data as a decision-making tool rather than a performance report.
That framing changes how you build your reporting cadence. Instead of reviewing every metric after every send, you track a small set of KPIs weekly, look for trend shifts over four to six sends, and investigate only when a trend breaks. This approach filters out the noise that comes from any single campaign’s quirks, whether that is a subject line that happened to land on a slow news day or a send time that competed with a major event.
Why revenue per email is the metric serious ecommerce brands watch most
RPE provides a clearer financial picture than isolated metrics like clicks or opens because it collapses the entire funnel into one number. A welcome series that generates $0.45 per email sent is objectively more valuable than one generating $0.12, regardless of which has the higher open rate. For ecommerce and SaaS businesses, RPE is the single metric that most directly connects email effort to financial outcome. You can read more about calculating and benchmarking it in Take-action’s breakdown of revenue per email.
Pro Tip: Set a baseline RPE for each flow type separately. Your abandoned cart flow will almost always outperform your newsletter on RPE, and comparing them directly obscures both. Benchmark each flow against its own historical performance, then optimize from there.
The case for behavioral metrics over passive ones
Many marketers misuse analytics as a report card rather than a forward-looking tool, overvaluing open rates inflated by privacy features and neglecting the metrics that indicate real customer intent. Clicks tell you what content resonated. Conversions tell you what drove action. RPE tells you what generated money. Open rate, at best, tells you that a pixel loaded.
The practical implication: when you are deciding whether to continue a campaign, change its content, or cut it entirely, base that decision on conversion rate and RPE, not on whether the open rate looks healthy. A campaign with a 15% open rate and a 3% conversion rate is performing better than one with a 40% open rate and a 0.5% conversion rate, full stop.
Segmentation as an analytics multiplier
Aggregate metrics hide as much as they reveal. A list-wide open rate of 25% might mask a highly engaged segment at 45% and a cold segment dragging the average down to 25%. Segmentation analysis reveals which audience groups engage best and where messaging or frequency adjustments are needed. Inactive segments require either a targeted re-engagement sequence or removal from active sends. Keeping them on your list inflates your send volume, suppresses your engagement rates, and risks triggering spam filters.
For ecommerce brands, the most useful segmentation cuts are typically by purchase history (buyers vs. non-buyers), engagement recency (clicked in the last 30, 60, or 90 days), and lifecycle stage (new subscriber, active customer, lapsed). Each group needs different messaging, different frequency, and different success metrics. Analytics only becomes useful when you can see those groups separately. You can go deeper on this in Take-action’s guide to measuring engagement for email campaigns.
Understanding how analytics in marketing drives better ROI is not just an email-specific discipline. The same principles of behavioral measurement, trend analysis, and segmentation apply across channels, but email remains the channel where they are easiest to implement and fastest to show results.
The brands that grow fastest with email are not the ones sending the most campaigns. They are the ones who know exactly which flows generate the most revenue, which segments respond to which messages, and which metrics actually predict customer behavior rather than just recording it.
Key Takeaways
Email marketing analytics works when you track behavioral KPIs tied to revenue, review them as trends across multiple sends, and integrate your email platform with your ecommerce or CRM backend for accurate attribution.
| Point | Details |
|---|---|
| Metrics vs. KPIs | KPIs tie metrics to business goals; tracking clicks without a revenue target produces noise, not insight. |
| Open rate limitations | Apple’s Mail Privacy Protection inflates open rates; weight CTR, CTOR, and conversion rate more heavily. |
| Revenue per email | RPE is the clearest financial signal for ecommerce; benchmark each flow type separately against its own history. |
| Integration is non-negotiable | Without connecting your email platform to your CRM or ecommerce backend, RPE and ROI calculations are estimates. |
| Take-action’s approach | Take-action builds Klaviyo-powered flows and segmentation strategies designed to grow RPE and conversion rates for ecommerce brands. |
How Take-action turns email data into revenue for ecommerce brands
Most ecommerce brands already have the data. What they are missing is the system that connects it, interprets it, and acts on it before revenue slips through the cracks.
Take-action is a specialized email marketing and retention agency built specifically for ecommerce brands that want email to function as a primary revenue channel, not a secondary newsletter. The difference is in the setup: Take-action builds Klaviyo flows (welcome sequences, abandoned cart recovery, post-purchase upsells) with attribution tracking wired in from day one, so RPE and conversion rates are measurable from the first send. There is no guessing at ROI and no retrofitting analytics after the fact.
For brands already sending email but not seeing the returns the channel is capable of, Take-action audits existing flows, identifies the segments and automations generating the most revenue, and rebuilds or extends the ones that are underperforming. The focus is always on behavioral metrics: clicks, conversions, and RPE, not vanity numbers that look good in a report but do not move the business forward.
If your email program is running but your analytics are not telling you where the money is coming from, get in touch with Take-action to see what a properly instrumented, revenue-focused email setup looks like for your brand.