

What Is a Klaviyo Metric? A Practical Definition for Marketers
A Klaviyo metric is a named category of event, like Placed Order or Opened Email, that records an action someone took and feeds your reports, segments, and automations. Every click, purchase, and unsubscribe your account tracks gets filed under one of these categories, and that’s what makes performance tracking, revenue attribution, and flow triggers possible in the first place.
Metrics matter because nothing else in Klaviyo works without them. Segments filter on metrics. Flows trigger off metrics. Dashboard cards summarize metrics. If you want to find them yourself, go to Analytics > Metrics.
- Click into any metric to see its definition, activity feed, and metric ID
- The metric ID (a six-digit number in the URL) is your trace point when troubleshooting integrations or querying the Metrics API
Pro Tip: Bookmark the Metrics page early. You’ll return to it constantly once you start building custom segments or auditing flow performance.
Key Takeaways
A Klaviyo metric is an event category that records customer actions, and accurate metric data is what makes segments, flows, and dashboards trustworthy.
| Point | Details |
|---|---|
| Definition | A metric is a named event category, like Placed Order, that Klaviyo uses to power reports and automations. |
| Creation paths | Metrics come from integrations, Events API requests, or CSV imports, with a 200 metric limit per account. |
| Access point | Find every metric under Analytics > Metrics, including its unique six-digit metric ID. |
| Conversion metric setting | Choosing the wrong conversion metric skews every revenue card on your dashboard. |
| Managed support | Take-action maps metrics, audits flows, and builds dashboards so metric errors get caught before they cost revenue. |
Table of Contents
- Where Do You Find Metrics in Klaviyo?
- How Are Klaviyo Metrics Created?
- What Are the Most Common Klaviyo Metric Types?
- How Do You Review and Slice Metric Data?
- How Do Metrics Power Segments, Flows, and Dashboards?
- When Should You Use the Metrics API?
- What Mistakes Should You Avoid With Klaviyo Metrics?
- How We Think About Metrics in Practice
- Get Help Turning Metrics Into Revenue
- Frequently Asked Questions
- Sources
Where Do You Find Metrics in Klaviyo?
Every metric in your account lives under Analytics > Metrics, listed alphabetically with a search bar and integration filter at the top. Klaviyo groups them by source (Klaviyo, Shopify, custom API events, and so on), so if you’re hunting for something specific, filtering by integration saves real time.
Here’s the fast path once you’re in:
- Search or filter the metrics list by name or source
- Click a metric name to open its detail view
- Note the metric ID in the URL bar (that six-digit number is what the analytics glossary calls the identifier tied to every metric)
- Scroll to the activity feed to see raw, individual events
- Export the data if you need it outside Klaviyo
Each account can hold up to 200 custom metrics, and Klaviyo emails the account owner as you approach that ceiling.
Pro Tip: If a metric name looks unfamiliar, check the activity feed before assuming it’s junk. It’s often a legitimate event from an integration you forgot was sending data.
How Are Klaviyo Metrics Created?
Metrics don’t require manual setup. Klaviyo generates them automatically from three sources: default metrics that arrive with an integration (Shopify’s Placed Order, for instance), custom metrics created the moment an Events API request uses a new event name, and metrics built from CSV imports.
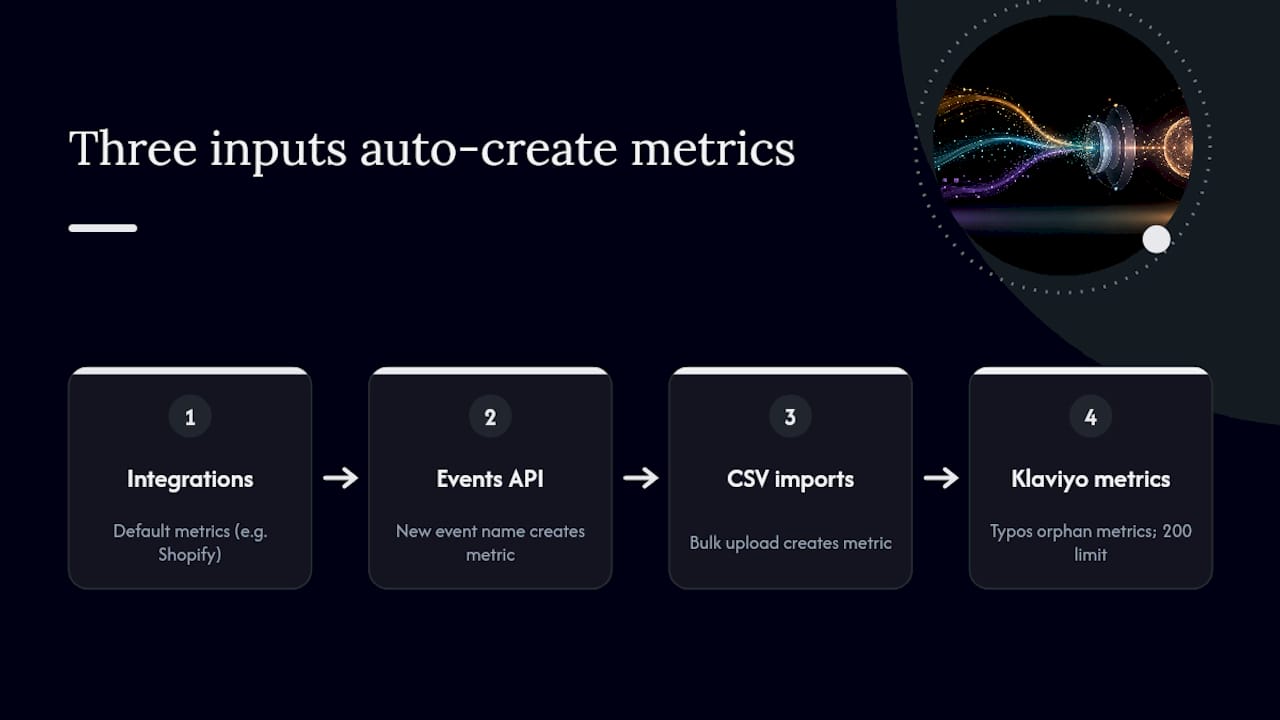
That third path is easy to overlook, but it means a one-time bulk upload can leave a metric in your account permanently, even after the campaign that prompted it ends.
The automatic creation behavior cuts both ways. It means you never have to configure tracking manually, but it also means a typo in an event name creates an entirely new, orphaned metric instead of adding data to the one you meant to use.
Naming discipline is the single most underrated skill in Klaviyo administration. A team firing “Product Viewed,” “product_viewed,” and “Viewed Product” from three different systems ends up with three fragmented metrics instead of one clean signal.
Pro Tip: Agree on an event-naming convention before you connect a new integration or API source, not after you’ve already split your data three ways.
With a 200-metric limit per account, teams running lots of custom API events need to watch this closely. Hitting the ceiling forces a cleanup project you could have avoided with better naming from day one. For a deeper look at custom event strategy, see Klaviyo Custom Events: Ecommerce Marketer’s 2026 Guide.
What Are the Most Common Klaviyo Metric Types?
Klaviyo metrics fall into a handful of practical categories, and knowing them helps you map your own KPIs to what’s already tracked automatically.
- Engagement: Opened Email, Clicked Email, Opened SMS
- Delivery status: Delivered, Bounced, Dropped
- Subscription activity: Subscribed to List, Unsubscribed, Unsubscribed from SMS
- Conversions and revenue: Placed Order, Ordered Product, Fulfilled Order
- Channel-specific: Sent SMS, Received SMS
The email metrics reference lists the exact definitions Klaviyo uses for Bounced, Clicked, Dropped, Opened, and Received email events, which is worth checking before you build a report around one.
Pay attention to unique versus total counts. Open rate is calculated as unique opens divided by deliveries for a given timeframe, not total opens, so a subscriber who opens the same email five times doesn’t inflate your rate.
Default metrics won’t always match your business logic. If a subscription renewal charge fires through the same Placed Order event as a genuine sale, you’ll want a custom metric that excludes it, so your revenue reporting reflects actual new purchases.
How Do You Review and Slice Metric Data?
Charts are your first stop for spotting trends, and the date range and aggregation settings you choose change what you actually see. All time gives you the long view; a custom 30 or 90 day range surfaces recent shifts a lifetime chart would smooth over.
- Open a metric and set your date range
- Toggle aggregation (daily, weekly) to match the pattern you’re investigating
- Drop into the activity feed to confirm individual events are firing correctly
- Apply filters to isolate a segment, source, or property value
- Export the data if you need to build something custom outside Klaviyo
- Cohort reports show how a group’s behavior changes over time, useful for comparing signup month to repeat purchase rate
- The raw activity feed is the fastest way to confirm a mapping issue isn’t the reason your numbers look off
Pro Tip: When a chart number looks wrong, check the activity feed before you touch your segment logic. Nine times out of ten, it’s a data mapping issue, not a segmentation bug.
How Do Metrics Power Segments, Flows, and Dashboards?
Metrics are the raw material behind nearly every decision Klaviyo makes for you automatically. A behavioral segment might filter on “Placed Order zero times in 60 days,” and a flow trigger might fire the moment “Started Checkout” occurs without a matching “Placed Order” within an hour. Both depend entirely on metric data being accurate.
- Segments filter on metric occurrence, frequency, and properties
- Flows trigger off a metric event, sometimes with a time-window condition attached
- Dashboard revenue cards depend on which metric you’ve designated as your conversion metric, which also sets your attribution window
Getting the conversion metric wrong is a quiet but expensive mistake. If it’s mapped to the wrong event, every revenue card on your dashboard misreports performance, and nobody notices until a monthly review turns up numbers that don’t reconcile with Shopify.
Standard KPIs worth tracking against metrics: open rate, click rate, conversion rate, and revenue per recipient. For a broader benchmark comparison, see Klaviyo Benchmarks Explained for Ecommerce Marketers, and for how these metrics translate into automated messaging, Klaviyo Email Automation Benefits for Ecommerce Brands.
When Should You Use the Metrics API?
The Metrics API is built for pulling metric data programmatically, and it’s the right tool once you outgrow the dashboard for reporting.
- Bulk exports for a data warehouse or BI tool
- Custom dashboards that blend Klaviyo data with other platforms
- Programmatic monitoring for teams that want automated alerts instead of manual dashboard checks
You’ll always need the metric ID (that six-digit identifier from the URL) to query a specific metric through the API. Large accounts should plan queries around date ranges and filters rather than pulling everything at once, since broad unfiltered requests slow down and complicate rate limit management.
Pro Tip: Grab the metric ID once and store it in your integration’s config. Re-hunting for it every time you touch the API wastes time you don’t need to spend.
What Mistakes Should You Avoid With Klaviyo Metrics?
Most metric problems aren’t technical. They’re process problems that compound quietly until a monthly report doesn’t add up.
- Set per-email alert thresholds for open rate, click rate, and revenue per recipient, not just flow-level averages that hide a broken automation
- Run separate alerts for deliverability issues (bounces, spam complaints) and performance issues (low engagement), since they need different fixes
- Audit flows weekly, not quarterly, so a silent failure doesn’t run undetected for months
- Watch for timezone mismatches: Metrics uses your account’s configured timezone while Segments runs on UTC, which can cause small discrepancies when comparing counts
- Don’t over-create custom metrics for events that are functionally identical; consolidate first
A flow that looks healthy in aggregate can still have one broken email inside it quietly losing revenue every day. Aggregate metrics hide exactly the kind of failure a per-email threshold would catch immediately.
Apple’s Mail Privacy Protection also distorts raw open counts, since it pre-fetches images regardless of whether a person actually opened the email. Weigh opens against clicks and conversions rather than treating open rate alone as gospel, a point echoed in third-party analysis of email platform metrics.
Pro Tip: If you’re running a custom integration, use Klaviyo’s mapped metrics tool to align your event names with Klaviyo’s semantic references. It keeps predictive models and default dashboards reading your data correctly instead of silently ignoring it.
How We Think About Metrics in Practice
The workflow we default to is simple: scan dashboards for a signal, drill into the metric’s activity feed to find the actual cause, then prioritize the fix by revenue impact, not by which alert is loudest.
Raw opens rarely tell the full story on their own. A metric like revenue per recipient tells you more about account health than opens ever will, because it ties engagement directly to money instead of a number Apple’s privacy settings can inflate.
Get Help Turning Metrics Into Revenue
Understanding what a metric tracks is one thing. Building a system where every metric feeds a working flow, an accurate dashboard, and a clean segment strategy is a different job entirely, and it’s the one Take-action does for ecommerce brands full time.
Take-action handles Klaviyo setup, metric mapping, dashboard builds, and ongoing flow audits so your team isn’t the one chasing down a broken trigger at 11pm. If your open rates look fine but revenue per recipient tells a different story, that gap is usually a metric mapping issue, not a content problem, and it’s exactly the kind of thing a flow audit catches fast. For a deeper look at how proper attribution setup changes what your reports actually show, see measuring marketing ROI for Klaviyo email campaigns.
If you want a second set of eyes on your current metric setup, book a consultation with Take-action and get a straight answer on what’s working and what’s quietly costing you revenue.
Frequently Asked Questions
What is a Klaviyo metric, in the simplest terms? It’s a category of event, like Opened Email or Placed Order, that Klaviyo records automatically and uses to power segments, flows, and dashboard reports.
How many metrics can one Klaviyo account have? Up to 200 custom metrics, with an email warning as you approach the limit.
Where do I find a metric’s ID? Open the metric under Analytics > Metrics and check the URL. The six-digit number there is the metric ID, which you’ll need for any API query.
What’s the difference between a default and a custom metric? Default metrics arrive automatically with an integration like Shopify. Custom metrics get created the moment an API request or CSV import uses an event name Klaviyo hasn’t seen before.
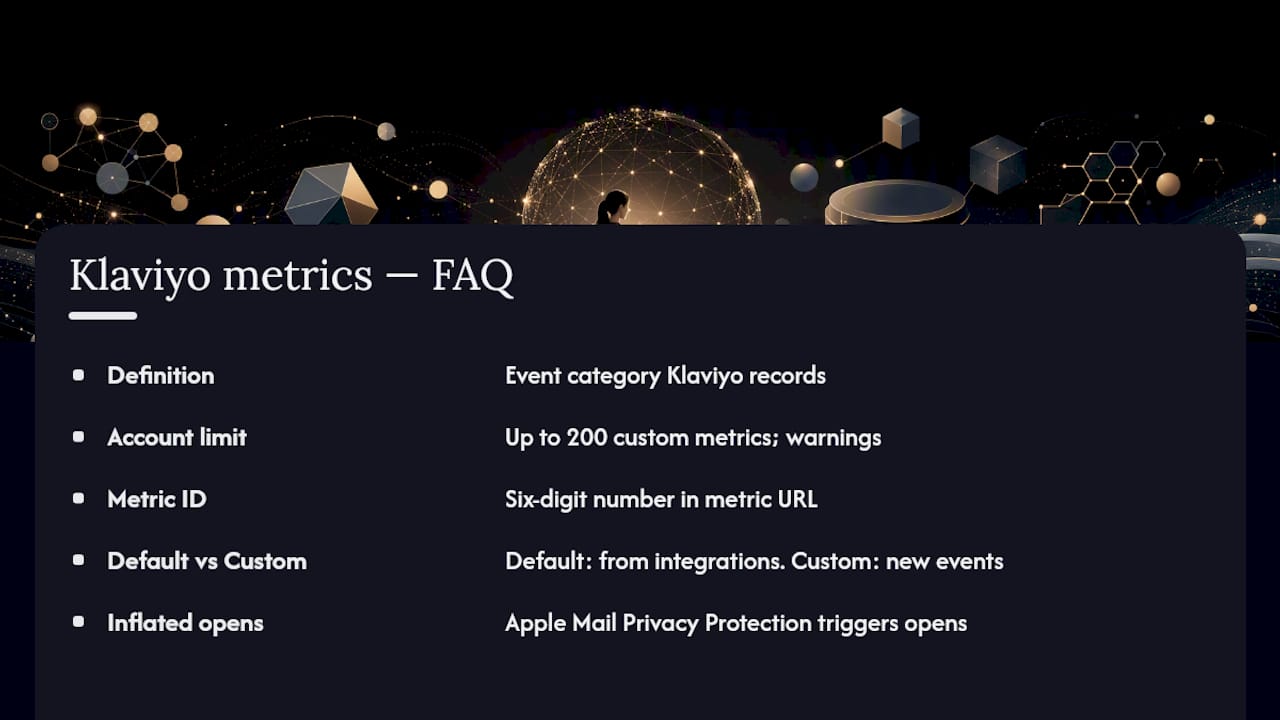
Why do my open rates look inflated? Apple Mail Privacy Protection can trigger automatic opens regardless of whether a person actually read the email, which is why revenue per recipient and click rate are more reliable performance signals.
Sources
- Analytics glossary | Klaviyo Help Center